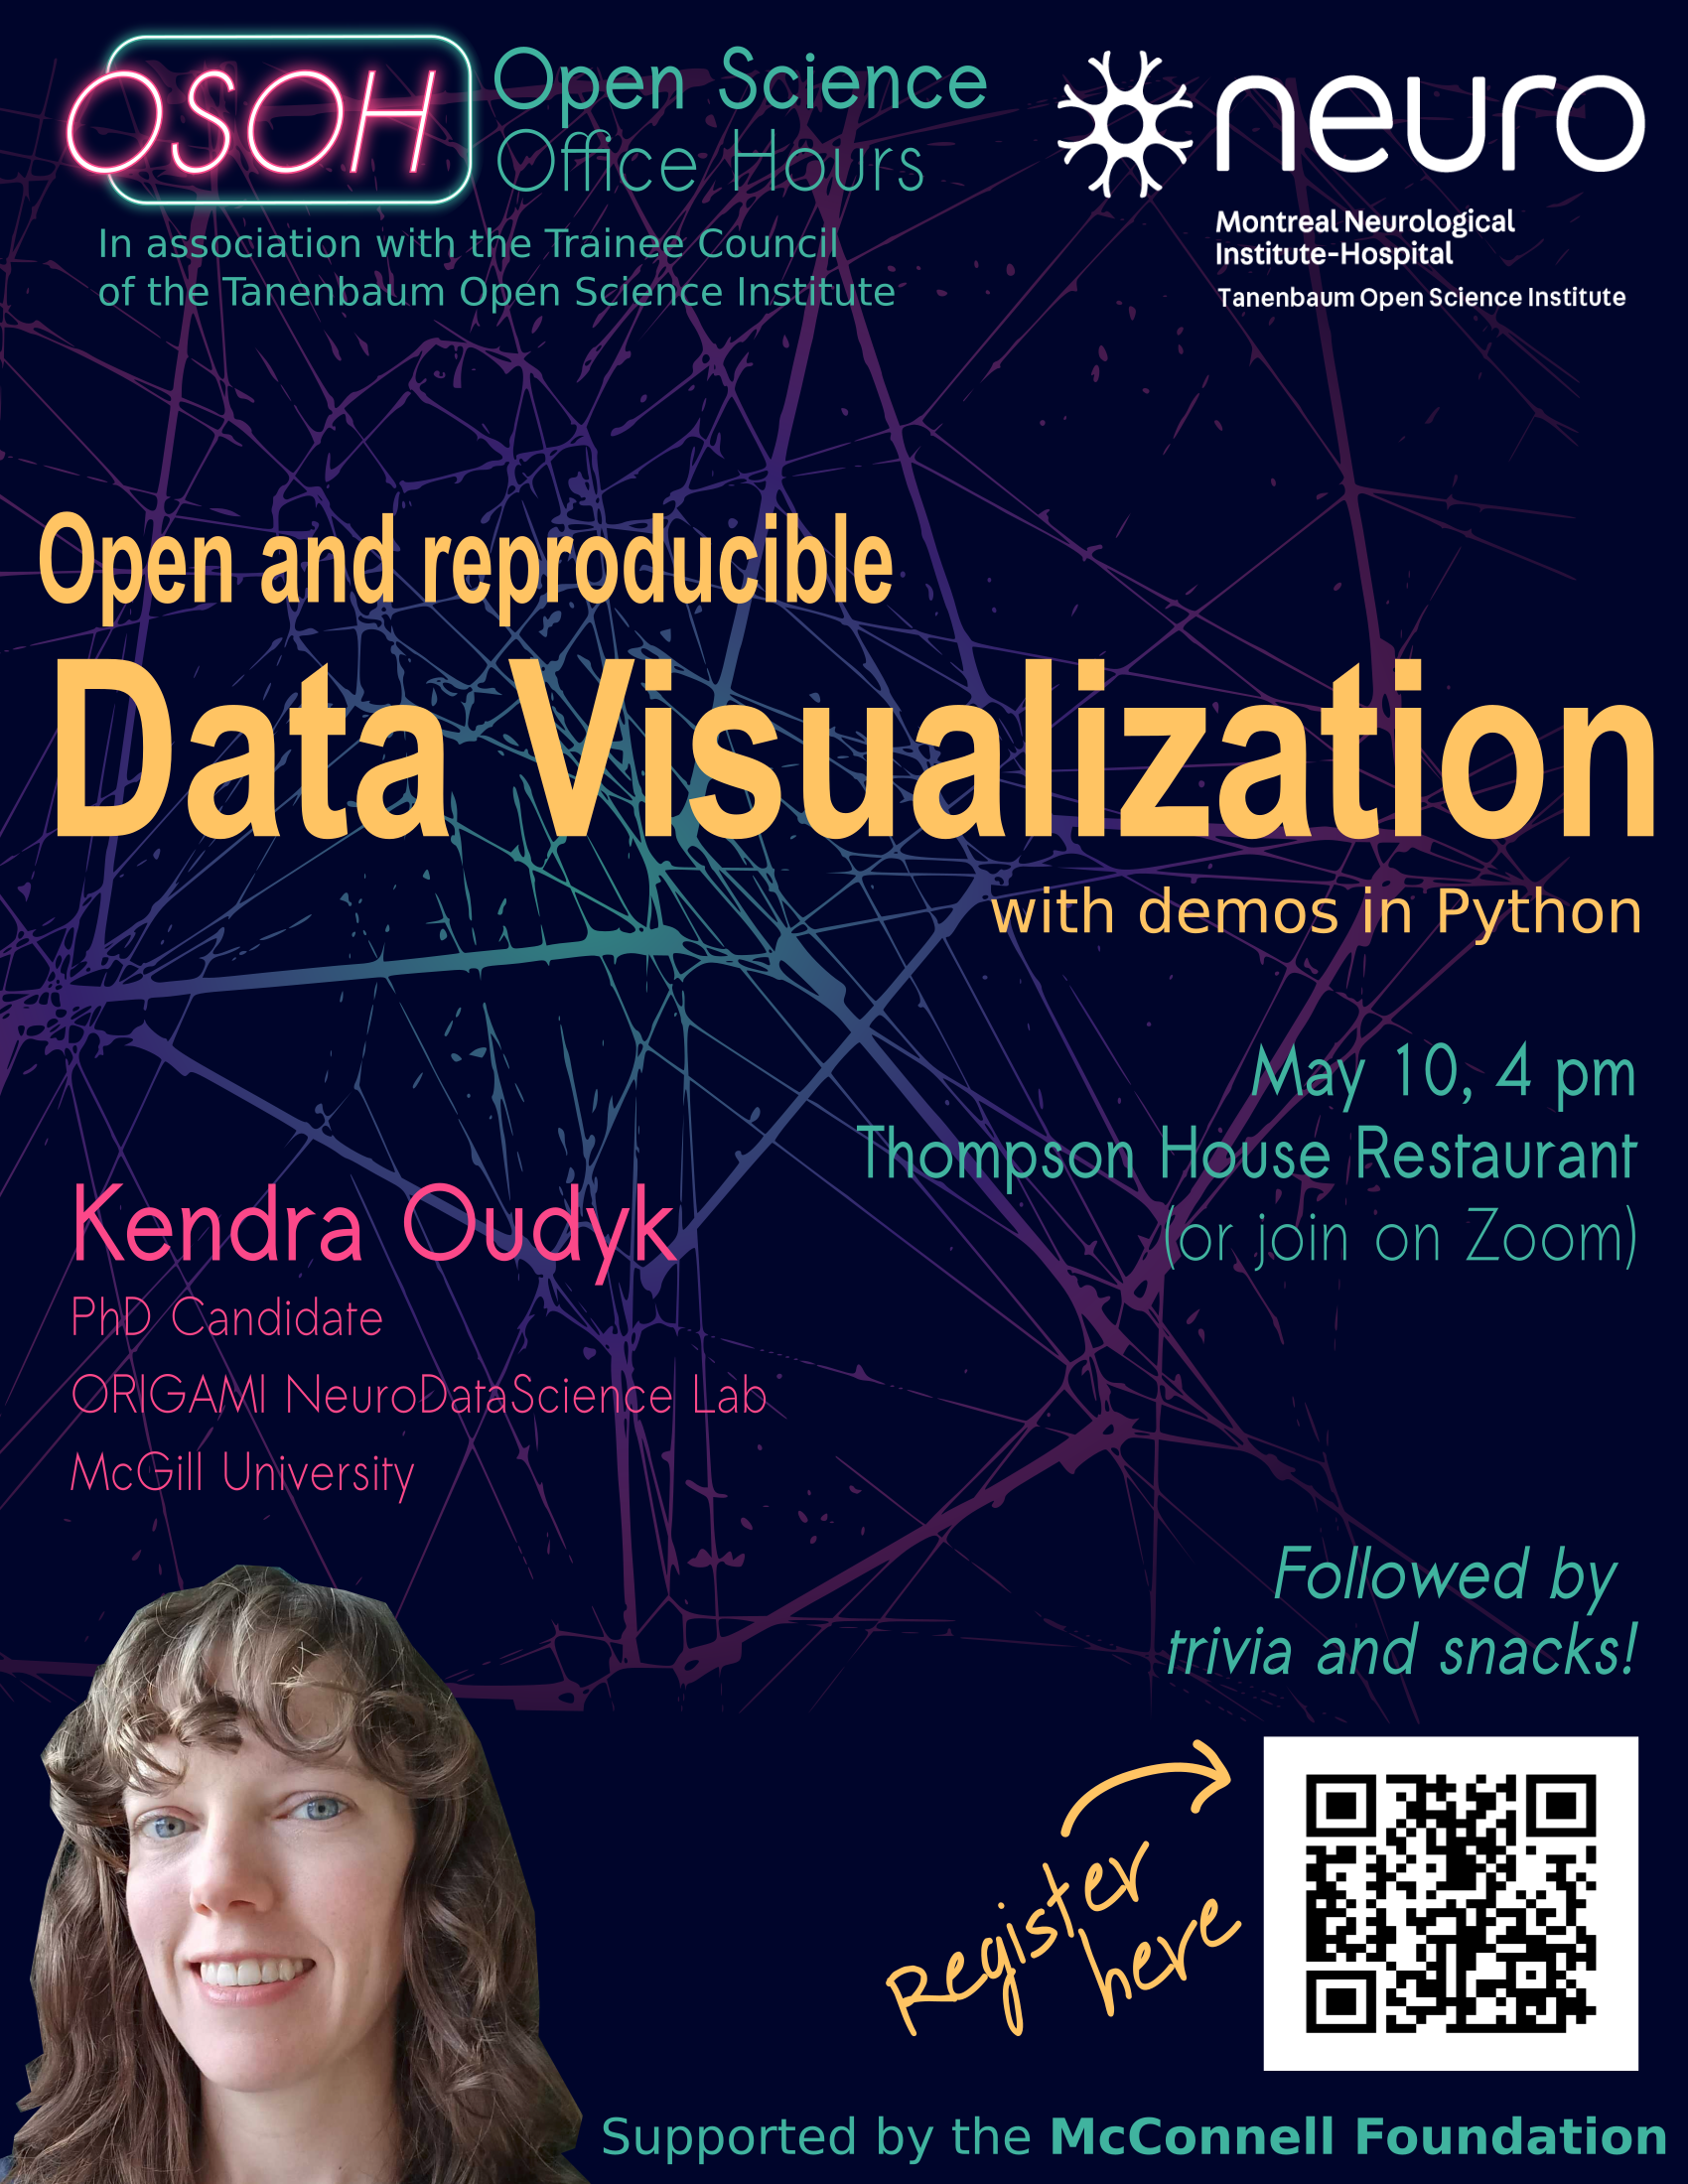
Data Visualization
Creating open and reproducible data visualizations in Python

Expert of the month
PhD candidate, McGill University
Kendra is a PhD candidate in the lab of Jean-Baptiste Poline, where she works on neuroimaging meta-research.
Seminar/Workshop
Friday, May 10 at 4 pm ET
Thompson House Restaurant And on Zoom (register for link)
This talk explores the principles and practices of open and reproducible data visualization, with demonstrations in Python. We will cover best practices for creating transparent, shareable, and reproducible visualizations, emphasizing the importance of open-source tools and reproducible workflows.
Key topics include:
- Data visualization principles and best practices
- Demonstrations of visualization techniques using Python libraries such as Matplotlib, Seaborn, and Plotly
- Documenting code for reproducible data visualization pipelines
Attendees will learn how to create a wide range of visualizations, and how to document their code for full reproducibility. Whether you are new to data visualization or looking to improve your skills, this talk will provide you with the knowledge and tools you need to create effective and transparent visualizations.